1. Organization and Easy Navigation
Groups allow you to organize your canvas effectively. By creating groups, you can easily locate specific visuals and maintain a structured layout. Imagine your canvas as a tidy workspace where related visuals are neatly grouped together.
2. Copy & Paste with Confidence
Have you ever accidentally hidden a visual while copying and pasting? Fear not! Groups come to the rescue. When you group visuals, copying and pasting becomes a breeze. You won’t miss any hidden elements, and your reports will remain consistent.
3. Bookmarks: Grouping for Storytelling
Bookmarks are powerful storytelling tools in Power BI. By grouping related bookmarks, you can create reusable narratives. For instance, group bookmarks related to different product categories or time periods. Then, use these groups in a Bookmark Navigator to guide users through your report.
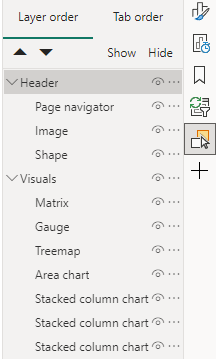
4. Layer Order Control
Visual layering can be tricky, especially when you want certain visuals to stay in the background. With groups, you can prevent visuals from popping to the front unintentionally. Users will appreciate the seamless experience as they interact with your report.
5. Reutilization: Custom Forms and Visuals
Sometimes, we craft custom forms using multiple visuals. Grouping these visuals allows easy reuse. Need to replicate that custom-made form elsewhere? Simply copy and paste the entire group, make necessary adjustments, and voilà!
6. Precise Alignment
Aligning multiple visuals manually can be a headache. But fear not! Groups provide an elegant solution. Aligning grouped visuals maintains their relative positions, even if you move them around. No more accidental misalignments!
Conclusion
As you embrace the power of groups in Power BI, remember that they enhance both your productivity and the user experience. Whether you’re organizing, copying, storytelling, or aligning, groups are your trusty companions. So go ahead, group those visuals, and create impactful reports!